Visualizing Fishing Effort
Heather Kitada
See full version
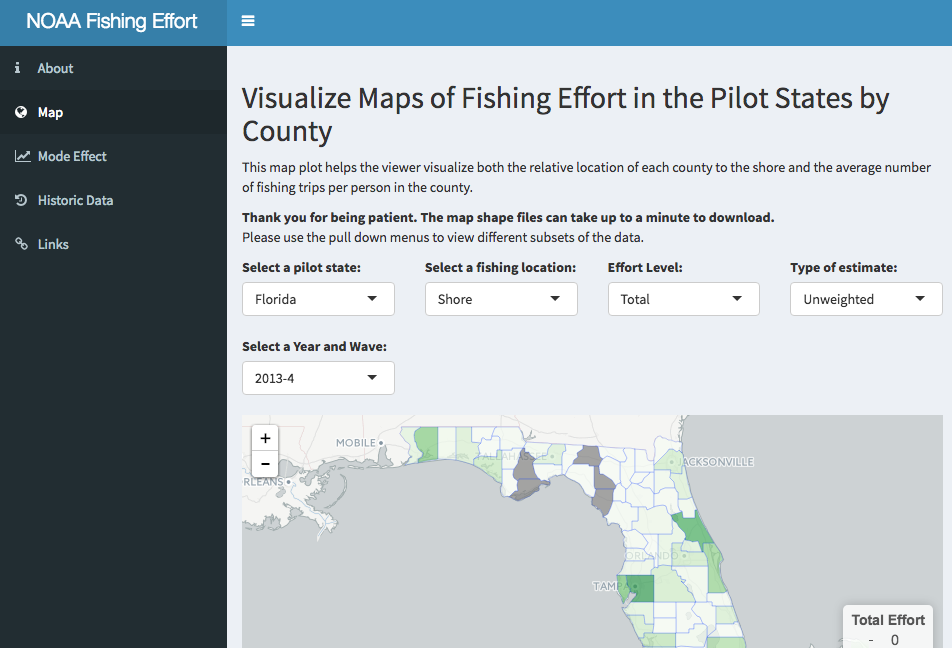
One of the National Oceanic and Atmospheric Administration (NOAA) responsibilities is to estimate fish stock, which are integral to managing fishery seasons and the availability of licenses. Although commercial fishing is highly regulated, recreational fishing is estimates are obtained by taking the product of two surveys. One survey is used to estimate the amount of effort (number of salt water) fishing trips respondents take on average and the other estimates the average catch per trip. In the past these data were collected by the Coastal Household Telephone Survey (CHTS) with RDD (random digit dialing) within a state; however, due to concerns about data quality they have transitioned to a mail survey pilot with an address frame and list of anglers who bought licenses in a given state. The literature on survey mode says that when respondents are asked to recall autobiographical event occurrence they often underestimate when asked in an interview (such as telephone), but do a better job estimating when they have paper survey (this survey also includes a calendar to help respondents). In this project we will focus on the estimation of fishing effort due to the implications of survey mode effect and explores ways of visualising pilot data.