Data Visualization Final Project
Anonymous
See full version
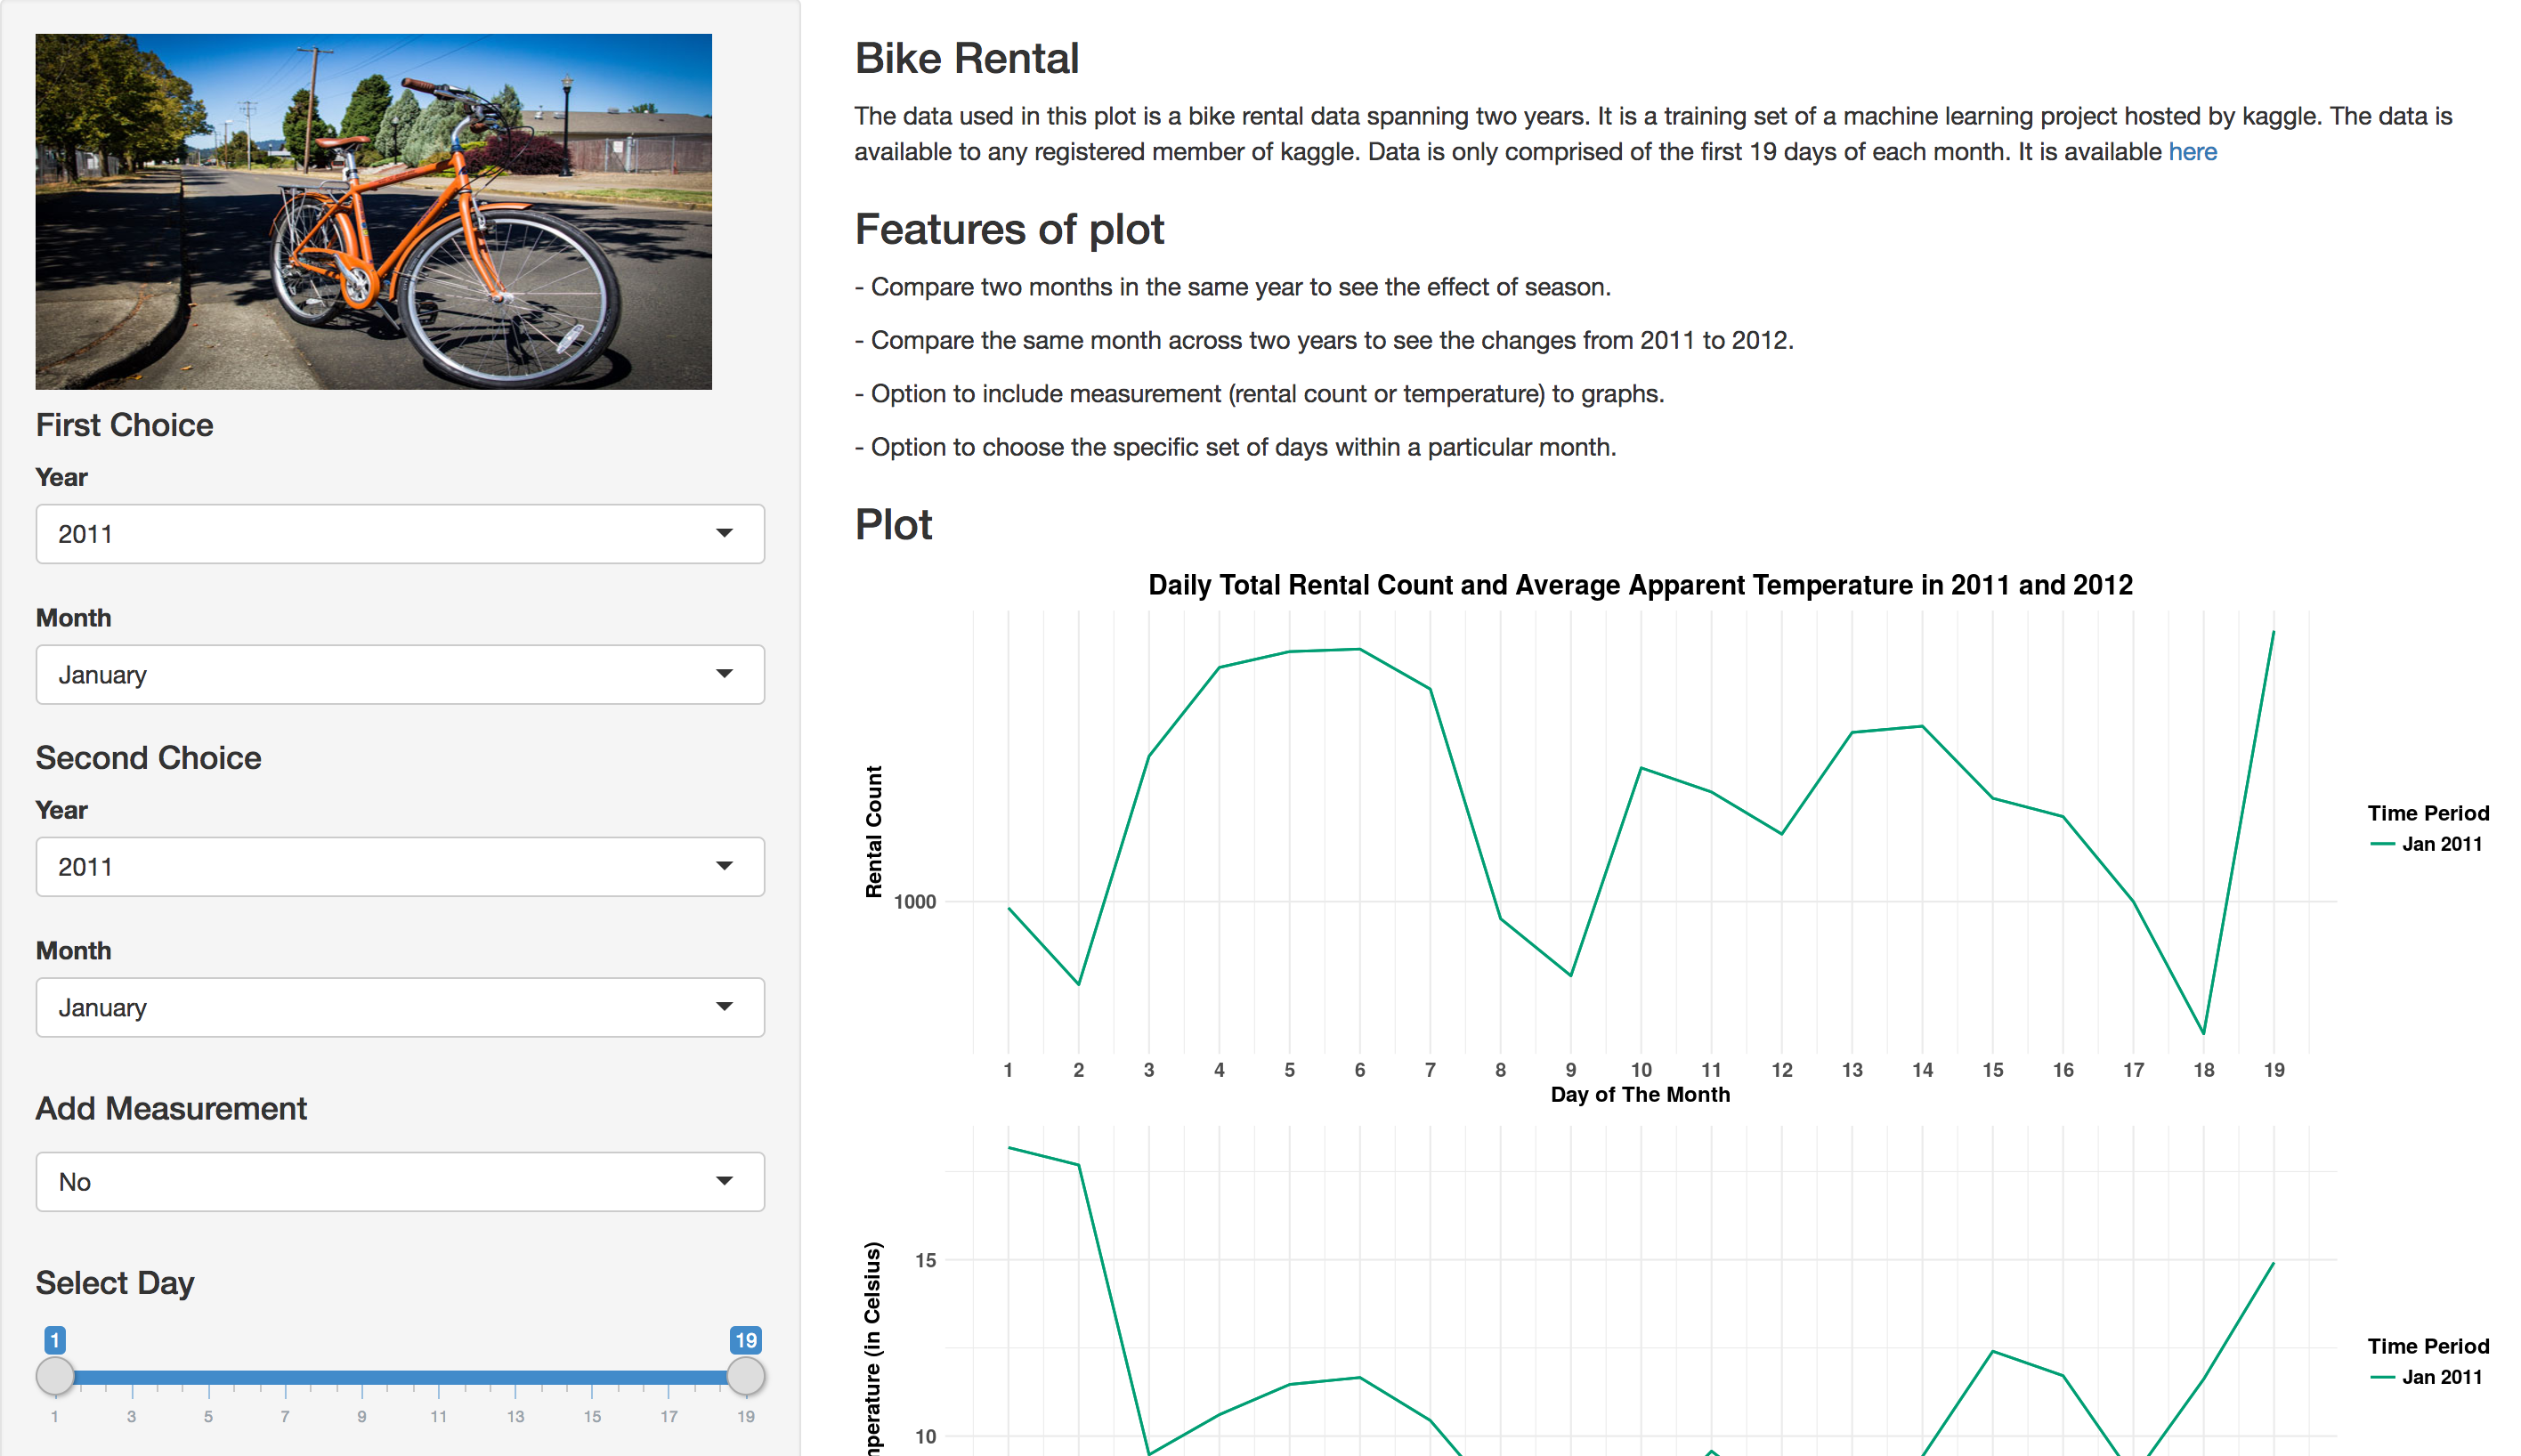
The purpose of the plot is to show how the demand of bike rental changed during 2011-2012 and how seasonality played a significant role in shaping this demand of bike sharing.